Multimedia
Development area
Soil resources
| Aim of the method/technique | Soil mapping aims to produce a soil map that describes the basic physical and chemical characteristics of the uppermost soil layers to a depth of 150 cm. A soil map includes the boundary of the various soil mapping units defined on the basis of certain classification systems. Soil surveys and maps provide essential information for the optimization of land management practices over space and time, to ensure proper management of land resources and to preserve the potential fertility and productivity in balance with the ecosystem (Elrashidi et al. 2010, Muckel 2004). |
||||||||||||||||
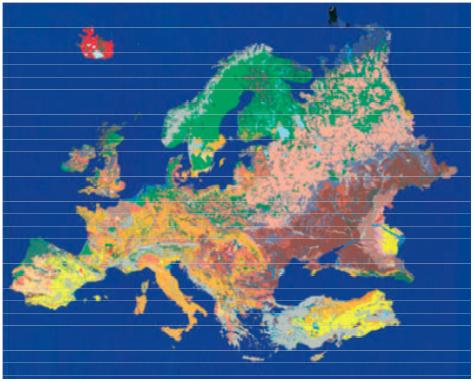
| Scale – spatial and temporal | The European soil map is presented at the scale of1:1,000,000 (Figure 1). This map was created by the European Soil Bureau, which operates through a network of European excellence research centres on the soil study. This scale renders the soil map almost useless in assessing land capability and land suitability for specific land uses for the purpose of LEDDRA project. A detailed or semi-detailed map at the scale 1:20,000 or 1:50,000 can be useful for regional studies. Soils present a high spatial variability but limited temporal change.
|
||||||||||||||||
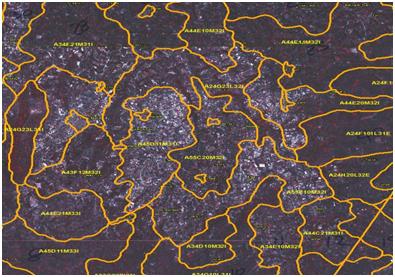
| Brief description | The basic unit used for describing soils is the soil body (Finke, et al. 1998). A soil body is a portion of the soil cover with certain diagnostic characteristics resulting from similar processes of soil genesis. Each soil body is described by a combination of characteristics such as parent material, presence of diagnostic horizons, soil texture, organic matter content, etc. The soil body is a small portion of land (covering a surface area of some square meters) with imprecisely known geographic boundaries. Therefore, for practical purposes, the soil mapping unit is used for mapping soils which includes many soil bodies with similar chemical and physical characteristics. A soil survey is a systematic examination, description, classification, and mapping of soils in an area. Soil maps are compiled by scientists who are familiar with the local soil-forming factors, an understanding of soil genesis, and the ability to identify the soil characteristics. Aerial photographs (ortho-photo-maps) are used as a map base to draw on it the soil mapping units (Figure 2). As a soil mapping unit is considered a piece of land having similar soil, topographic, and geo-morphological characteristics. The soil surveyor walk over the land and describe for each mapping units selected morphological properties affecting plant growth, land management, and land degradation.
|
||||||||||||||||
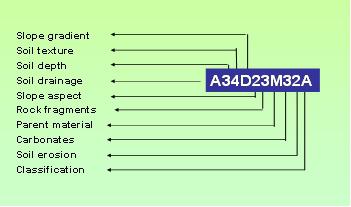
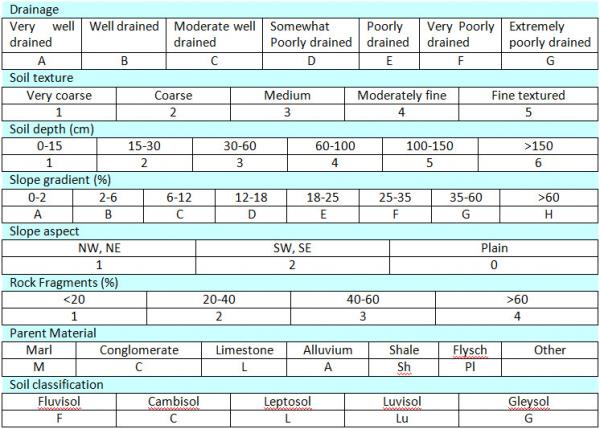
| Data requirements | Important data requirements for characterizing soil mapping units are: parent material, soil depth, slope gradient, texture, rock fragment content, drainage, slope aspect, degree and direction of soil development, degree of soil erosion, etc. In particular, the soil texture classes are defined according the USDA system (Soil Survey Staff, 1975), and are grouped into the following textural classes: very coarse (S, LS), coarse (SL), medium (L, SiL, Si), moderately fine (SCL, CL, SiCL), fine (SC, C, SiC), and very fine (clay content>60%). Soil texture can be estimated in the field through the feel of a moist soil molded between fingers and thumb. This is a qualitative way to describe soil texture. The standard analysis of sand, silt and clay content involves dispersion of mineral particles after removing the organic matter and measuring by the Bouyoucos hydrometer method (Gee and Bauder, 1986). The parent material is defined based on the geological map of the area as it was mentioned above. Soil depth to unconsolidated bedrock is measured in auger holes or in soil cuts. The following classes are used: very shallow (depth 0-15 cm), shallow (15-30 cm), moderately shallow (30-60 cm), moderately deep (60-100 cm), deep (100-150 cm), and very deep (>150 cm). Slope gradient is described using the topographic maps or a clysimeter. The soils are classified according to FAO soil classification system (Finke et al. 1998) into three broad categories (Soil Orders), viz. Cambisols, Luvisols, Fluvisols, etc. Soil drainage conditions are defined on the basis of the depth of hydromorphic features such as iron or manganese mottles or gray colours, and depth of the groundwater table. The following drainage classes are distinguished:
Rock fragments are pieces of rocks of 2 mm diameter or larger those are strongly cemented or more resistant to rupture. They are present on the soil surface or distributed in various quantities into the soil body. Rock fragments are classified according to their diameter to the following categories: pebbles (diameter 2-75 mm), cobbles (diameter 75-250 mm), stones (diameter 250-600 mm), and boulders (diameter >600 mm). Rock fragments in the soil surface are defined according to the percentage cover in three classes (Poesen and Lavee 1994; Moustakas et al. 1995): abundant, rock fragments (RF)>40%; many, RF=15-40%; and common, RF<15%. The degree of erosion is assessed qualitatively during the execution of the soil survey. In all mapping units, the present situation of erosion is characterized, according to: (a) the presence or not of the A-horizon; (b) to the existence and percentage of eroded spots; (c) to the degree of exposure of the parent material on the soil surface; and (d) to the presence of erosional gullies as following:
|
||||||||||||||||
| Main applications in cropland and forests & shrubland regions | Soil maps are important tools for assessing various functions, processes and uses of a region such as: (a) soil erosion, (b) land degradation vulnerability, (c) land capability for various land uses, (d) appropriate response assemblages for land protection, etc. | ||||||||||||||||
| Strengths and weaknesses | Detailed or semi-detailed soil maps are available in limited areas. Furthermore, soil mapping and classification systems vary among regions and countries. An effort has been made in the last decade to collect soil data using a certain methodology, “the geo-referenced database”. Furthermore, soil maps using previous technology include soil properties of various classes, different classification systems, non-accurate scale, and they are available on a hard copy (not digitized). Finally, mapping soils requires many field observations by expert soil scientists. |