Multimedia
Development area
Air temperature
The air temperature an area is usually described in terms of average (daily or monthly) values, average monthly minimum and maximum values, and monthly absolute minimum and maximum values. These characteristics are presented in graphs showing the change of air temperature with time.| Aim of the method /technique | The method aims to describe basic characteristics of air temperature which are: (a) average daily and monthly values, (b) daily and monthly average minimum and maximum values and (c) absolute monthly minimum and maximum values. | ||
| Scale – spatial and temporal | Air temperature data are based on point observations (meteorological stations). The link with soils, vegetation, and landscape requires the allocation of the geographical area covered by each data collection station. Thiessen polygons can be used for regionalization of point climatic data. Thiessen network can be corrected taking into consideration topographic features. A period of at least 30 years is necessary to describe the prevailing air temperatures of an area. |
||
| Brief description | Air temperature data are recorded on hourly or daily basis. Altitude and geographical coordinates of the observation station in meters are necessary for environmental studies. The average daily or monthly values are calculated by the following equation (Steel et al. 1997):
Where xi is one value from a set of numbers i=1 to n, and n is the number of observations. |
||
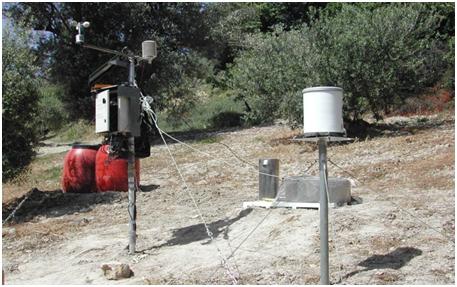
| Data requirements | Data required to calculate mean daily and monthly characteristic values of air temperature are provided by the regional or national Meteorological Services or the regional administration. The necessary data are: (a) daily air temperature, (b) daily minimum air temperature, and (c) daily maximum air temperature. Recently, meteorological data are collected with automatic meteorological stations in which data are collected continuously in a data logger and transmitted in central administration office for elaboration (Figure 1).
|
||
| Main applications in cropland and forests & shrubland regions | Air temperature characteristics of an area constitute a basic part of natural resources inventory and ecosystem performance in cropland regions such as plant growth, soil water balance, soil water evaporation, ecosystem resilience, biodiversity, etc. | ||
| Strengths and weaknesses | The proposed method includes standard basic statistical analysis used for biological studies. The main weakness of the proposed method is usually attributed to the basic data required (quality and time period of data available) for the analysis. |