Multimedia
Development area
Aridity index
Aridity index (AI) is an estimate of the average water available in the soil. This index is usually defined as the ratio between mean annual precipitation (P) and mean annual evapotranspiration (ETo). The aridity index can be estimated by the Bagnouls-Gaussen index (BGI) that is also a component of the Climate Quality Index, as described below.| Aim of the method/technique | The proposed method aims to classify the climate in relation to water availability. The higher the BGI, the greater the water deficiency for the growing plants in an area. For example areas with BGI greater than 150 is considered as extremely dry. |
| Scale – spatial and temporal | The calculation of BGI requires climatic data. Therefore, the spatial scale of the index requires regionalization according to the method proposed for the raw climatic data. A period of at least 30 years is necessary to describe the prevailing aridity in a study area. |
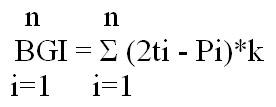
| Brief description | The Bagnouls-Gaussen aridity index (BGI) can been calculated by the following equation:
Where: ti is the mean air temperature for month i in 0°C, Pi is the total precipitation for month i in mm; and k represents the proportion of month during which 2ti - Pi >0. The k value can be determined by the umbro-thermic diagram. Based on the DESERTLINKS European research project, the following classes are distinguished for this index: (a) very low aridity, BGI<50, (b) low aridity, BGI ranging from 50-75, (c) moderate aridity, BGI ranging from 75-100, (d) high aridity, BGI ranging from 100-125, (e) very high aridity, BGI ranging from 125=150, and (f) extremely dry aridity, BGI>150. |
| Data requirements | The data required for the calculation of BGI are: (a) average monthly air temperature, and (b) average monthly amount of rainfall. |
| Main applications in cropland and forests & shrubland regions | Aridity is a critical environmental factor affecting the evolution of natural vegetation. The aridity index classifies the type of climate in relation to water availability. The higher the aridity index of a region the greater the water resources variability and scarcity over time, the more vulnerable to desertification is the area. |
| Strengths and weaknesses | The proposed method is very simple with low data requirements. However, since the meteorological data are point observations the BGI has to be regionalized based on the Thiessen method. A period of at least 30 years of meteorological data are required. |