Cropland
Characteristics of cropland: general
Authors: Constantinos Kosmas, Katerina Kounalaki, Mina KaramesoutiEditor's note: Text extracted from D111-2.1
It is estimated that about 11 percent (1.5 billion hectares (ha)) of the globe’s land surface (13.4 billion ha) is used for crop production (Bruinsma 2003). This area represents slightly over a third of the land estimated to be, to some degree, suitable for crop production. The remaining roughly 2.7 billion ha of land with crop production potential suggests that there may be a possibility for further expansion of agricultural land. However, the majority of this land is marginal, degraded land or land under adverse climatic conditions for crop production. Global natural resources, especially soils and water, are already under great pressure, highly degraded in many areas, and restoration is of high priority (Lal 2010). Loss of ecosystem resilience, due to increasing demands from a growing world population, would create severe impacts on ecosystem services.
Based on analyses of remote sensing data at the end of last millennium (Chandrashekhar et al. 2009), the total global rain-fed cropland area is estimated at 1.13 Bha (Figure 1). The first two classes in Figure 1 (corn-soybean-wheat dominant, and wheat-cotton-barley dominant) are predominantly rain-fed cropland, covering about 50 percent of the area. As can be seen, rain-fed croplands and grasslands, rain-fed croplands and shrublands, and rain-fed croplands and woodlands account for between 34 and 40 percent of the total area covered by rain-fed crops, and between 12 and 25 percent of the classes of grassland dominant with rain-fed croplands, shrublands dominant with rain-fed croplands, and woodlands dominant with rain-fed croplands (Chandrashekhar et al. 2009). Of the 1.13 Bha of rain-fed croplands in the world, Asia dominates with 29 percent of the total, followed by Europe (20 percent), North America (17 percent), Africa (17 percent), South America (14 percent), and Australia (3 percent).
The geographical distribution of total rain-fed cropland is closely correlated with the geographical distribution of human populations (Chandrashekhar et al. 2009). The highest percentages of total rain-fed croplands are mainly located in countries with high populations. The United States, Russia, China, Brazil and India account for the highest percentages of rain-fed cropland areas in the world. China and India, with about 2.6 billion people, mostly depend on irrigated agriculture to produce enough food to feed their populations (Thenkabail et al. 2008). In contrast, North America and Europe, with a combined population of about 1.3 billion depend on rain-fed agriculture.
|
|
Figure 1. Global map of rain-fed cropland areas derived using a fusion of 1-km SPOT VGT, 10-km NOAA AVHRR, and numerous secondary data. Sourcfige: (Chandrashekhar et al. 2009). |

Worldwide, the area of irrigated land has increased from 97 Mha in 1950 to 275 Mha in 2000. Globally, the land area needed to feed one person decreased from about 0.48 ha in 1950 to 0.25 ha in 2000 (Ausubel 2001) and it is expected to decrease in the future. One of the major questions concerning the future of irrigation is whether there will be sufficient freshwater to satisfy the growing needs of agricultural and non-agricultural users. Agriculture already accounts for about 70 percent of the freshwater withdrawals in the world and is usually seen as the main factor behind the increasing global scarcity of freshwater. Climate change associated with drought and extreme weather events is expected to affect crop yields, especially in the semi-arid climatic zone, by reducing water availability for agriculture and increasing energy prices (Zilberman et al. 2008; Collier et al. 2008; Levine 2009). In addition, genetic modification of plant varieties has led to improvements in performance for growing under low water availability, which in turn is advancing food security (Falkenmark et al. 2009; Rockström 2003; Finkel 2009).
The land area under crops has increased by a factor of 5.3 between 1700 and 2000 (Figure 2), while the area of cropland per capita has progressively declined (Brown 2004; Funk and Brown 2009). Globally, on average only 0.26 ha of cropland per capita (including irrigated and rain-fed) is available for food production. The total per capita area of cropland available for food production has decreased due to population growth, soil degradation, and salinisation (Thomas and Middleton 1993; Worldwatch Institute 2001; Preiser 2005). Europe and North America accounts for 16 percent of the global area of cropland but has only 9 percent of the total population of the world. Asia accounts only 0.17 ha of cropland per capita, which is lower than the 0.26 ha global average. North America has the highest area of cropland per capita (0.74 ha) followed by Europe (0.36 ha), South America (0.31 ha), and Africa (0.26 ha).
 |
Figure 2. Estimates of land area under cropland. Source: (Adapted from FAO 2008; Richards et al. 1990). |
World demand for food is expected to double between 2005 and 2050 (Borlaug 2007), due to population increase and changes in dietary preferences (Lal 2010). During the 20th century, it is estimated that the global population increased by a factor 3.8; urban population increased by a factor 12.8; water use increased by a factor 9; irrigated cropland area increased by a factor 6.8; fertilizer use increased by a factor 342; and the production of organic chemicals increased by a factor 1000 (Ponting 2007). Global cereal yield increased from about 1500 kg ha–1 in 1961 to about 3000 kg ha–1 in 2005, while the harvested area decreased from 0.21 ha per person in 1961 to 0.10 ha per person in 2005 (Funk and Brown 2009). One third of the increase in cereal production worldwide during the 1970s and 1980s has been attributed to increased fertilizer consumption (Figure 3). Crop production has also increased during that period due to increasing cropping intensity, as well as to expansion of the arable area (Bruinsma 2003).
Areas prone to soil degradation are estimated at 1965 Mha globally, comprising 1094 Mha prone to water erosion (Lal 2010), 549 Mha to degradation by wind erosion, 239 Mha to degradation by chemical degradation, and 83 Mha to physical degradation (Oldeman 1994). Secondary salinisation of irrigated land, affecting about 73 Mha worldwide, has adverse impacts on crop production. Two thirds of the land vulnerable to degradation is in Africa and Asia, including the Middle East. These are also the world’s two most populous regions, in which two thirds of the expected increase of 3 billion people will live.
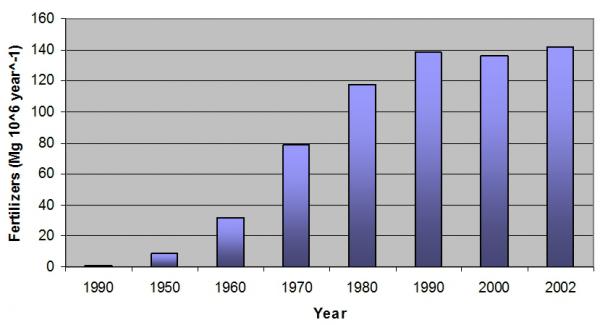 |
Figure 3. Total world fertilizer consumption. Source: (Adapted from IFDC 2004; Tilman et al. 2001; Ponting 2007). |
The main trends in cropland in Europe are towards conversion of arable land and permanent crops to pasture, set-aside and fallow land (EEA, 2005). There are three major aspects to consider: (1) the conversion of agricultural land to urban land; (2) conversion and rotation from pasture to arable land and vice versa within agriculture; (3) withdrawal of farming with or without forest creation and conversion of forested and natural land to agriculture. Across Europe and Central Asia, the farming sector is affected by growing polarization between intensive commercial agriculture and low-income, less productive farming systems that are increasingly being abandoned (EEA 2007). However, agriculture still includes diverse systems, ranging from large, highly intensive and specialised commercial holdings to subsistence farms mainly using traditional practices. Consequently, impacts on the environment vary in scale and intensity and may be positive or negative.