Multimedia
Development area
Biodiversity indices - forests & shrubland
Biodiversity is related to species richness, density, and diversity of an ecosystem. If an ecosystem is overexploited, the consequence is the loss of biodiversity potentially expressed by direct loss of vegetation and animal species. In forest/shrubland ecosystems, biodiversity indices are usually applied both at forest and landscape level. At forest level several indexes are commonly used, depending on data availability (field surveys, forest inventory with qualitative and quantitative information (Corona et al., 1989), forest map with qualitative information based on field surveys (Costantini et al. 2006), forest map based on supervised remote sensed classification, etc.). In this ambit a widely used index is the Diversity index as proposed by Shannon and Weaver (1949). At regional level a well known index is the γ diversity (Whittaker, 1972).| Aim of the method/technique | The proposed techniques aim at characterizing the species composition of the forest component both at forest and regional level. |
| Scale – spatial and temporal | Scale can vary from local to regional, based on availability of forest surveys. Updates of forest maps data collection usually vary from 10 to 20 years. |
| Brief description | Forest level. Starting from the information related to a forest map (type and percentage of species present in each elementary unit), it is possible to characterize the forest biodiversity by using Shannon and Weaver (1949) diversity index: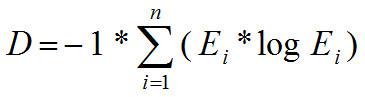 Where, D is the diversity index; i is the i-th species in the elementary unit; n is the number of species in the elementary unit; Ei is the proportion of i-th species in the elementary unit; ; logEi is the logarithm (base 10) of Ei . Regional level. An index to assess the biodiversity at landscape level is the γ diversity (that measures the overall diversity within a large region) as proposed by Whittaker (1972). |
| Data requirements | Vegetation maps, Forestry maps with single species composition content (type and percentage of species present in each elementary area mapped), remote sensed data (Modis, Landsat TM), land cover maps. |
| Main applications in forests & shrubland regions | Description of biodiversity levels in forest/shrubland ecosystems, both at forest and regional level, can be useful in assessing the impacts of various responses to LEDD. |
| Strengths and weaknesses | Strengths are referred to the capability to apply very simple analysis also with opportunity for diachronic analysis. Possible weaknesses stand in the (sometimes restricted) spatial and temporal availability of data. |