Multimedia
Development area
Biodiversity indices - grazing land
One of the impacts of land desertification is loss in biodiversity. If an ecosystem is overexploited, the consequence is the loss of biodiversity expressed by direct loss of plant species and the animals associated with them. Biodiversity indices are used to express the change in biodiversity.In rangeland ecosystems, grazing can have a significant effect on plant species diversity. Commonly, biological diversity is associated with the efficient use of resources and ecosystem resilience. Herbivores can affect the habitat and influence species distributions by increasing or decreasing heterogeneity, which depends on the pre-existing spatial pattern of vegetation and the spatial distribution of grazing. The additive partitioning of species diversity is a way to quantify the components of diversity among scales and measure the contribution of local communities to regional diversity (Lande 1996).
| Aim of the method/technique | The proposed technique aims to characterized change in biodiversity at different spatial scales. |
| Scale – spatial and temporal | |
| Brief description | The Proportional diversity H’ index integrates richness and evenness using the Shannon information index (Shannon 1948), 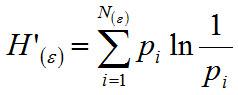 where pi is the probability that a given species occurs. Gamma, γ, diversity is the total species diversity in a set of samples, and is partitioned into the average diversity within samples (α) and among samples (ß); i.e. Υ=α+ß, (Wagner 2000). Beta, ß, diversity is the variation in species composition among sites within a region (Whittaker 1972). Beta diversity can be calculated by one of the following methods:
|
| Data requirements | The required data are field data samples (randomly or stratified distributed) in the landscape |
| Main applications in grazing regions | The partitioning of plant species diversity across landscapes and regions has been investigated in grazing lands ecosystems (Komac et al. 2011). Description of biodiversity indices of a grassland ecosystem can be useful in assessing the impacts of various LEDD drivers. |
| Strengths and weaknesses | Defining biodiversity requires expertise in biology with the ability. Strengths are referred to the capability to apply very efficient statistical analysis of the defining plant species distribution. A weakness is the complete spatial and temporal availability of data. |